About Our Charts
We use two charts on our homepage that showcase just how lopsided comparisons between the average charity and the best charities truly can be. While we recommend that most people view our recommended funds page to learn about the charities we support, those that desire to delve more deeply into the numbers behind those choices can do so here.
Global Health
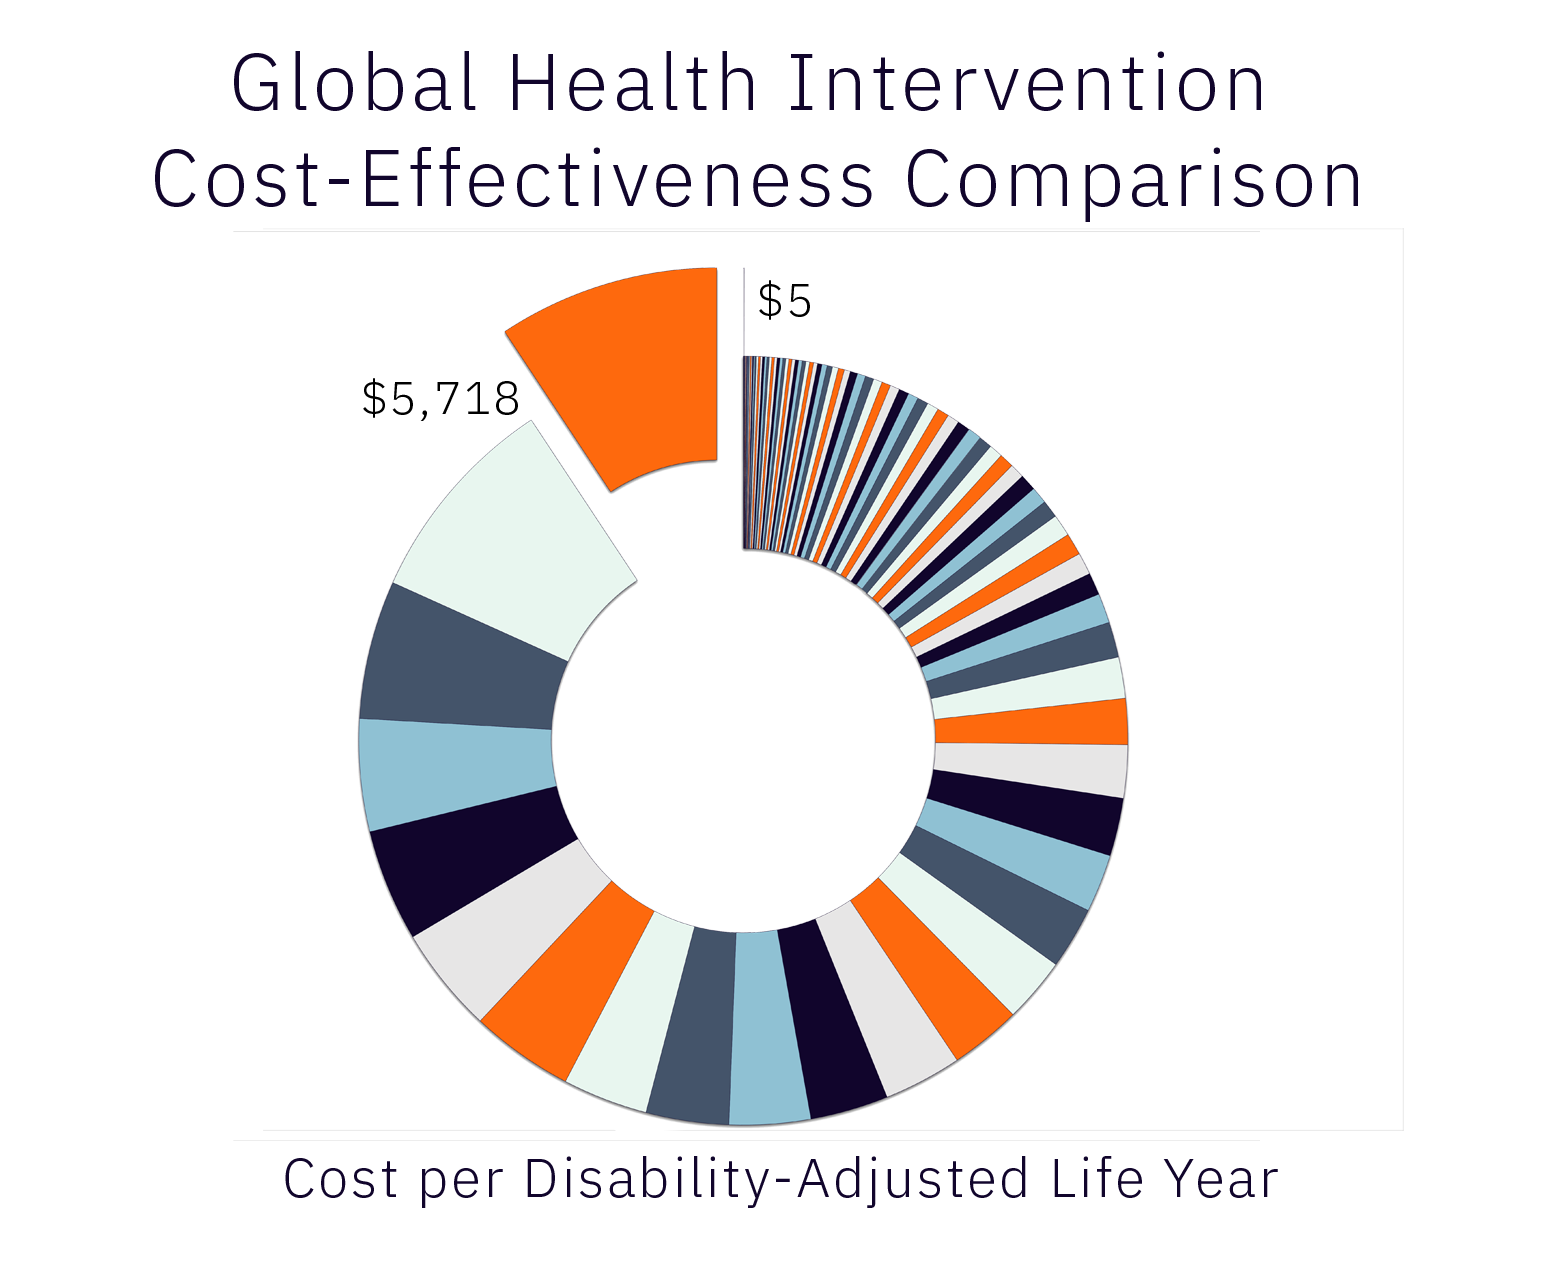
Our Global Health Intervention Cost-Effectiveness Comparison Chart uses data from Part 3 of Disease Control Priorities 3 (DCP3), a report released by the Disease Control Priorities Project that aims to determine priorities for disease control across the world, particularly in low-income countries. Each slice represents a recommended global health intervention listed in Disease Control Priorities 3. While even the least effective of these are considered important to focus on for developing countries, the most effective interventions are literally three orders of magnitude more effective than the least recommended interventions.
The approximate cost per disability-adjusted life year (DALY) for the cheapest intervention is $5, while the most expensive in the DCP3 is $5,718/DALY. The average intervention approximately costs $222/DALY. This means that donating $100,000 toward the least effective intervention would cause less good than a single $100 donation toward the most effective intervention.
In this chart, each global health intervention listed in the DCP3 is represented by a slice of the pie, with the width of each piece corresponding to the cost in US dollars per disability adjusted life year. This means that the most cost-effective intervention, at $5/DALY, is 1143 times as effective as the least cost-effective intervention at $5,718/DALY. The top intervention is between 42 (median) to 135 (mean) times as good as the average intervention.
We can also look at each intervention in terms of how many DALYs you get per $1,000 spent. The least effective intervention nets 0.17 DALYs/$1,000; the median 4.69 DALYs/$1,000; the mean $18.44 DALYs/$1,000; and the best gives 200 DALYs/$1,000.

This chart uses data from the DCP2, an earlier version of the report. It was created by Toby Ord for his 2013 paper The Moral Imperative toward Cost-Effectiveness in Global Health, but all other numbers listed prior to Ord’s chart are from the DCP3 version of the data.
While there are concerns with using DALYs rather than QALYs, and while there are additional concerns beyond just the raw cost-effectiveness numbers, it nevertheless remains clear that some cause areas are just better deals than others. As William MacAskill points out:
"One additional unit of income can do a hundred times as much to the benefit the extreme poor as it can to benefit you or I. [I]t's not often you have two options, one of which is a hundred times better than the other. Imagine a happy hour where you could either buy yourself a beer for $5 or buy someone else a beer for 5¢. If that were the case, we'd probably be pretty generous—next round's on me! But that's effectively the situation we're in all the time. It's like a 99% off sale, or buy one, get ninety-nine free. It might be the most amazing deal you'll see in your life."
— William MacAskill, Associate Professor in Philosophy and Research Fellow at the Global Priorities Institute, University of Oxford, and author of Doing Good Better
Toby Ord points out that the global health interventions listed by the Disease Control Priorities Project don’t even include some of the most effective interventions we know of. Smallpox eradication, for example, cost ~$400 million and saved 100 million lives—that’s less than $4 per life saved, a statistic that is significantly superior to all interventions listed in the DCP3. But Toby Ord points out that it goes further:
"[T]he eradication also saved significant amounts of money. Approximately $70 million was being spent across developing countries per year in routine vaccination and treatment for smallpox, and more than $1,000 million was lost per year in reduced productivity. Even just in the United States, smallpox vaccination and vigilance cost $150 million per year before eradication. The eradication programme thus saved more lives per year than are lost due to war, while saving money for both donors and recipients, paying back its entire costs every few months. It serves as an excellent proof of just how cost-effective global health can be."
— Toby Ord, Senior Research Fellow in Philosophy at Oxford University and author of The Precipice: Existential Risk and the Future of Humanity
Our Global Health Intervention Cost-Effectiveness Comparison chart data is from the DCP3 and the chart design is by Katherine Hess.
Animal Welfare

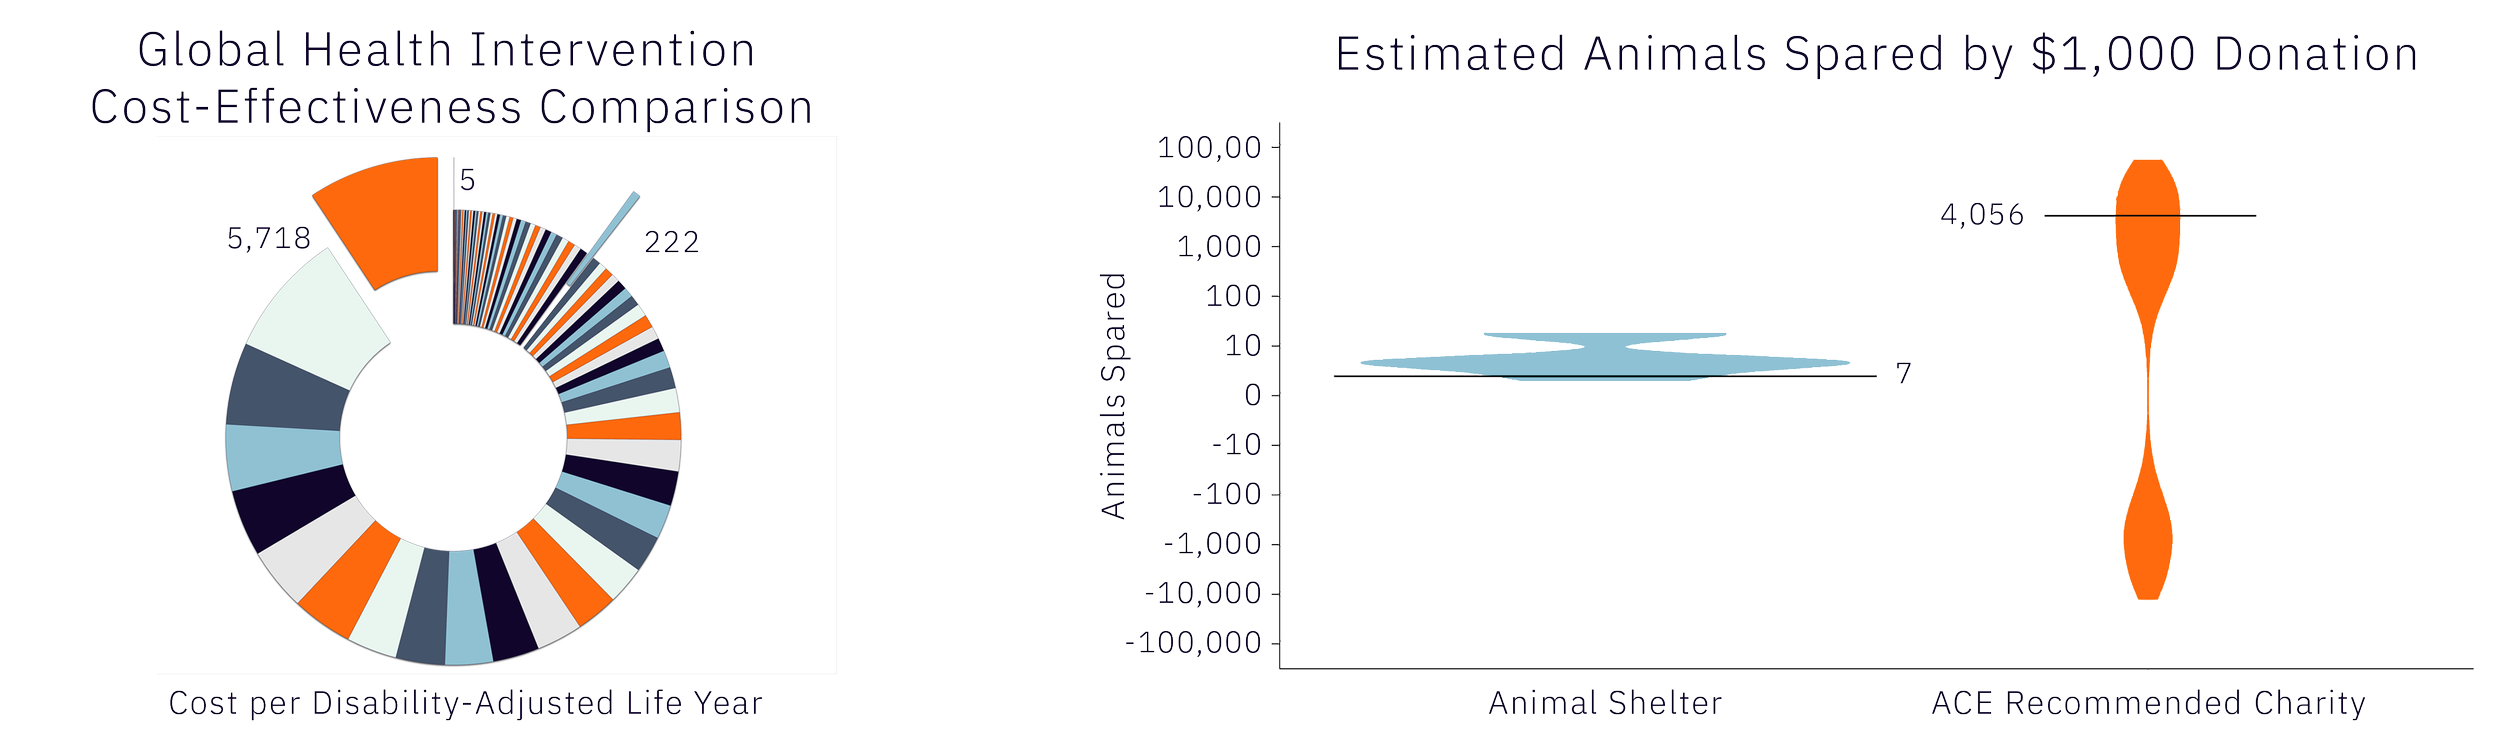
The disparity between the average intervention and the best interventions are even more stark when it comes to animal welfare or the long-term future. In the above graph, Animal Charity Evaluators points out that ACE’s recommended charities are orders of magnitude more effective than the average animal shelter charity.
In this probability distribution chart, the width at any point corresponds to the probability mass that the actual number of animals spared is the listed number. On average, we expect ACE Recommended Charities to spare about 4,000 animals from harm for every $1,000 donated.
The data in this chart comes from the ACE’s 2017 combined distribution cost-effectiveness estimates for The Humane League, Animal Equality, L214, Open Cages, and Compassion in World Farming USA. The data was collated by Allison Smith and Kieran Greig.
Cost-Effectiveness
Clearly, it’s not enough to just give to any charity. If choosing the best charities can increase how much good you do by a thousand times or more, then correctly choosing which charity you give to will likely be far more important than how much you choose to give in the first place. Remember: when the difference between the most and least cost-effective charities is three orders of magnitude, that means that giving $100,000 to one charity might result in less good than merely giving $100 to the right charity.
Note that while the charts highlighted on our homepage focus on cost-effectiveness estimates, our recommended funds look at more than just cost-effectiveness when determining which charities to fund. For example, GiveWell looks at: “(1) evidence of effectiveness, (2) cost-effectiveness, (3) transparency, and (4) room for more funding”; while Animal Charity Evaluators considers : “(1) Programs, (2) Room for More Funding, (3) Cost Effectiveness, & (4) Leadership and Culture”; and, as the fund managers of Giving What We Can’s Longtermism Fund, Longview Philanthropy reviews via monitoring how orgs use funding, considering whether the org requires additional funding, and incentivizing orgs to be even more impactful, all while using a scientific mindset and intellectual honesty. Cost-effectiveness is but one input that goes into determining the most effective charitable causes overall.